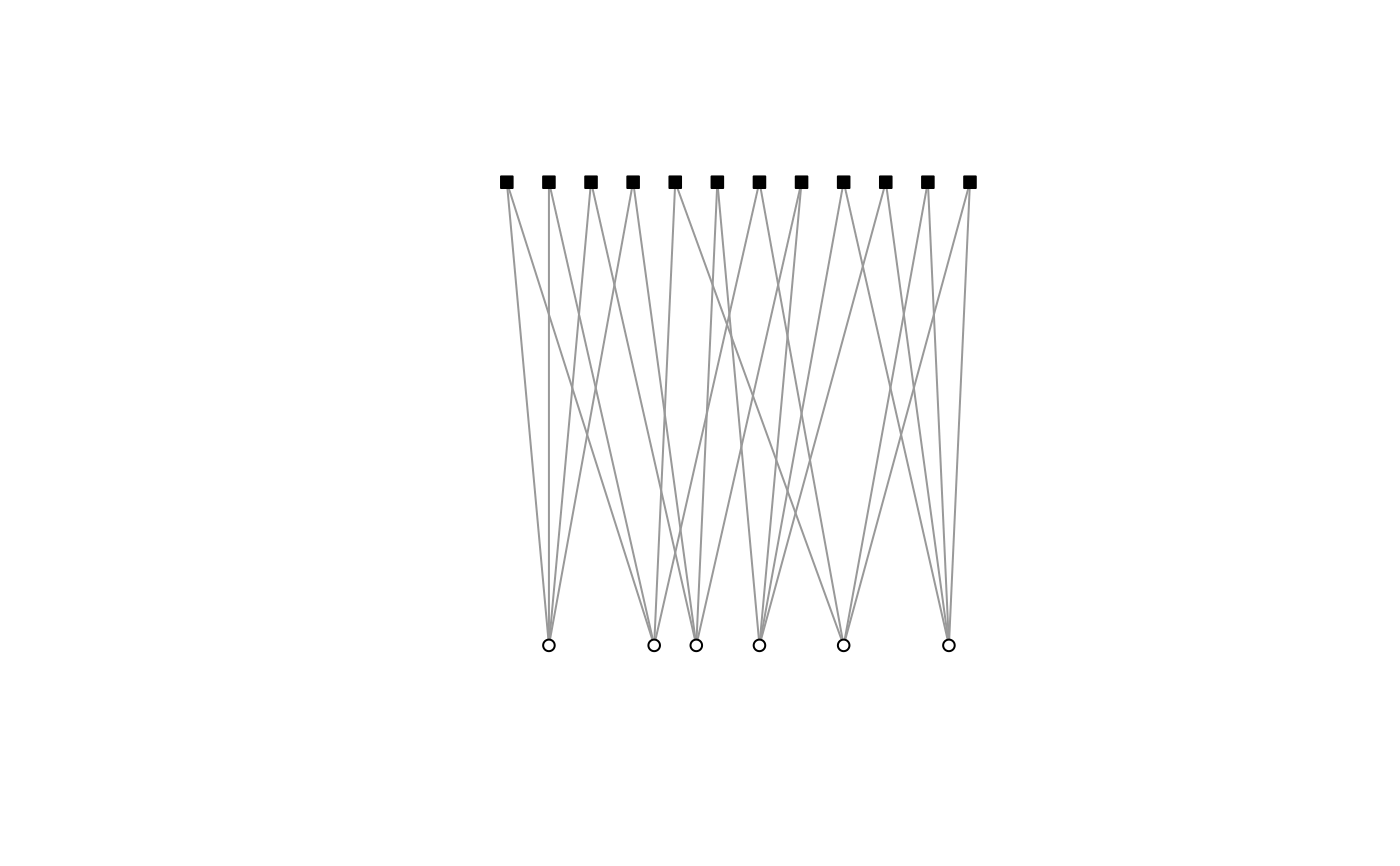
Plotting two-mode networks
plot_twomode.RdBetter default plotting of two-mode networks than igraph
plot_twomode(mat, attr = NULL, greyscale = T, ...)
Arguments
| mat | A matrix |
|---|---|
| greyscale | Whether to use black/white or blue/green, Default: T |
| ... | Any other arguments passed to igraph.plotting |
Value
A plot
Details
Makes for clearer communication of structure than igraph defaults for two-mode networks by providing default colours, shapes, size, and frames, and avoiding labels.